Final Project Proposal Brainstorming
I really struggled with getting started with this week’s assignments. I wasn’t quite sure what the relevance of selecting an object to research on Google Maps had to do with a “bigger picture” or where I should even start. After contacting and meeting with my professor, Joey Lee, it was clear that I wasn’t thinking about the process correctly.
In preparation for our meeting, Joey sent me a couple of links and ideas to think about. Some of the things we talked over were a couple articles by Ben Wellington about the NYPD systematically ticketing legally parked cars for millions and a $791M error in an approved NYC budget.
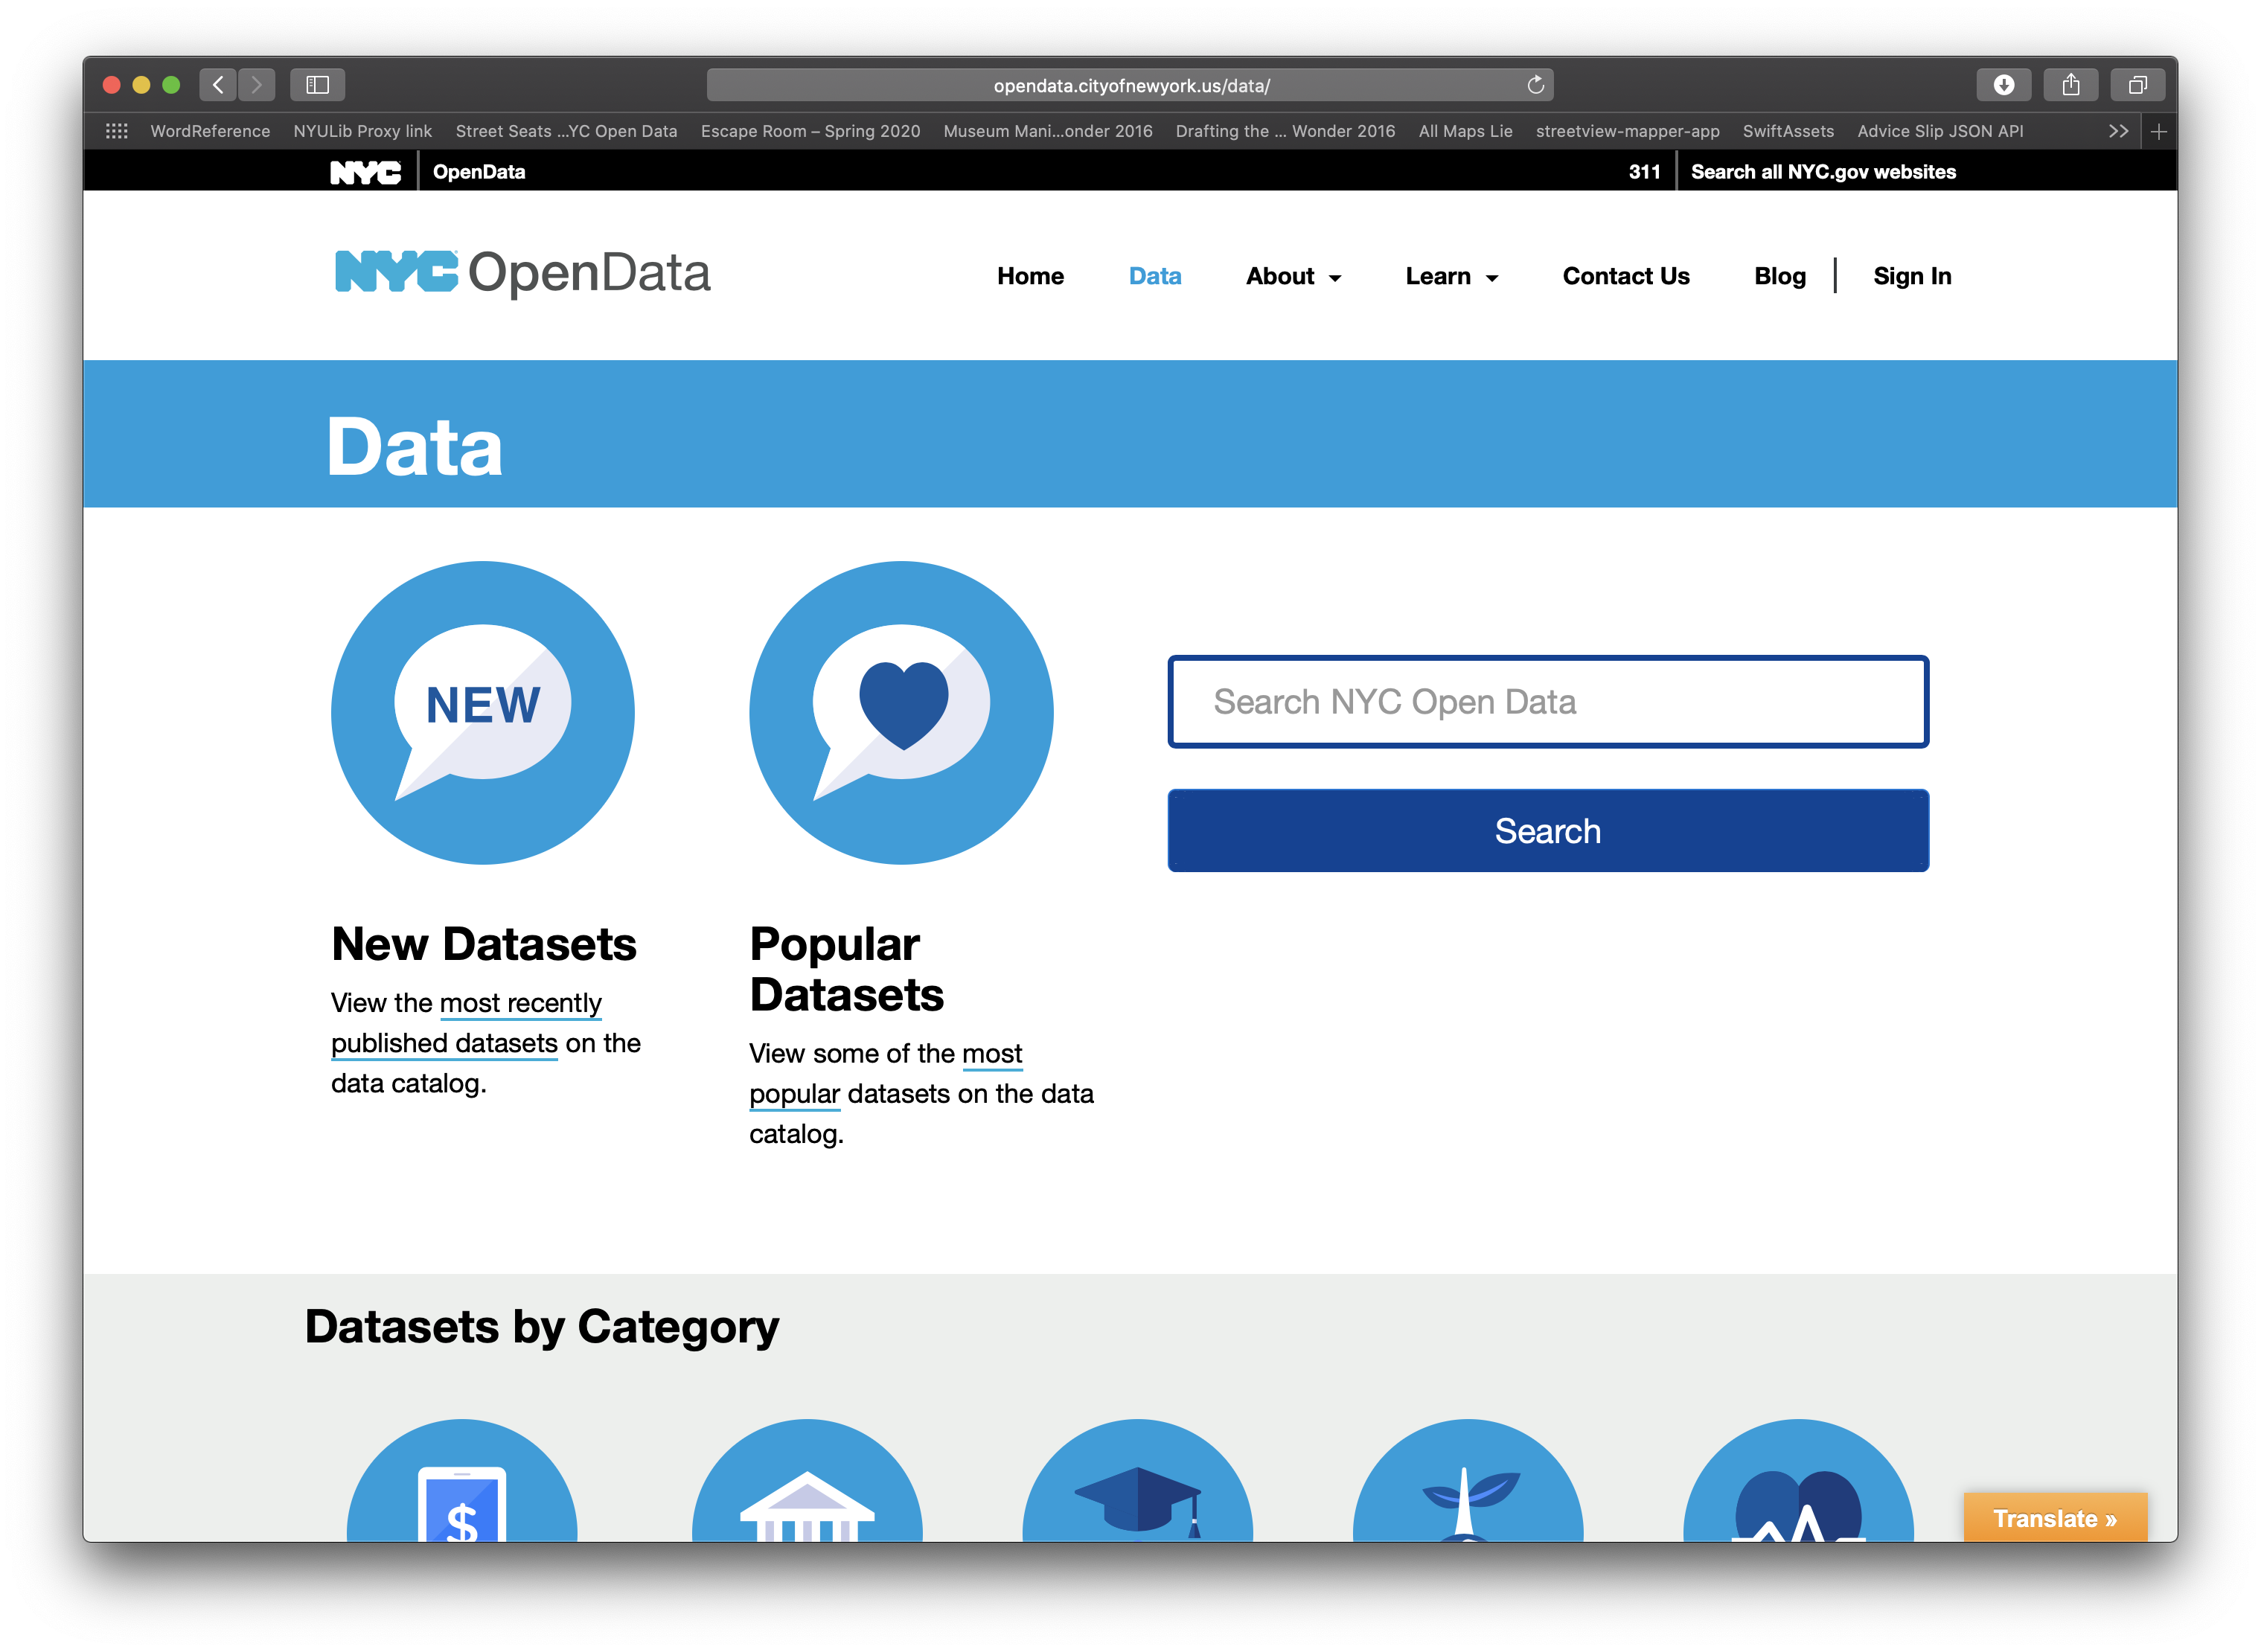
In discussing these and other articles, I started to better grasp a glimpse of the type of data relationships Joey had suggested for our class. By looking more closely at how the information publicly available from NYC OpenData worked together to support different research, I realized that I should take a more top down approach to this. The idea is to use data (and their relationship)—such as objects from Google Maps and NYC OpenData—in researching/explaining/understanding a topic.
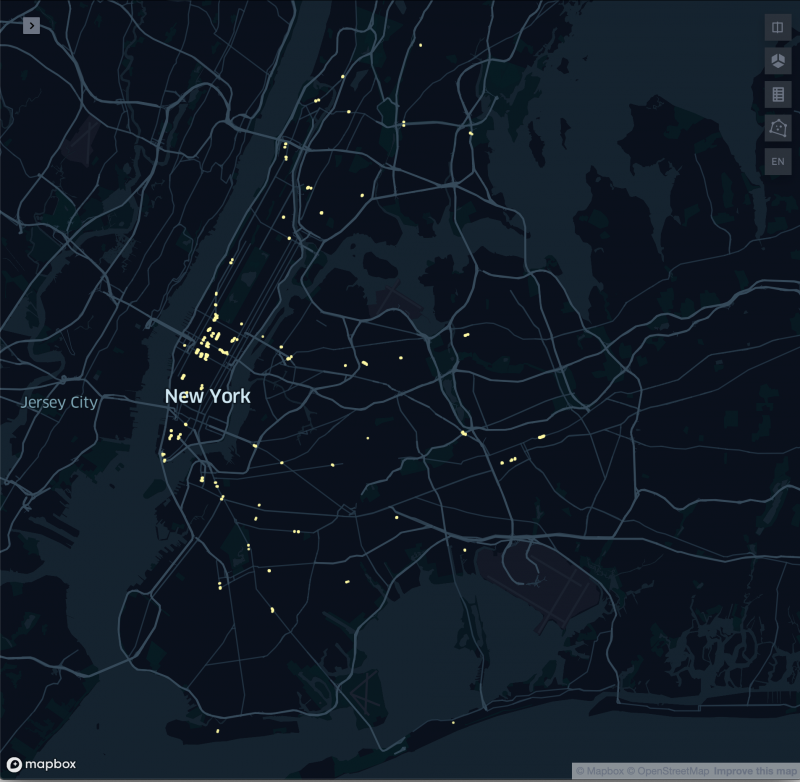
Newly-motivated, I spent about an hour looking through different databases available on NYC OpenData, trying to understand the information in the tables and what they might say about the City, as well as exporting it and sorting it a bit. In the end, I decided to go with the Street Seats Database. While NYC OpenData offered a Street Seats Map Database, I don’t really know NYC that well, so I thought it would be really interesting to see the types of places for which the City approved public seating located in the street. I was curious about where in the City these places were, but I was even more curious to see what these parts of town looked like and if there were any commonalities between the 24 selected sites.
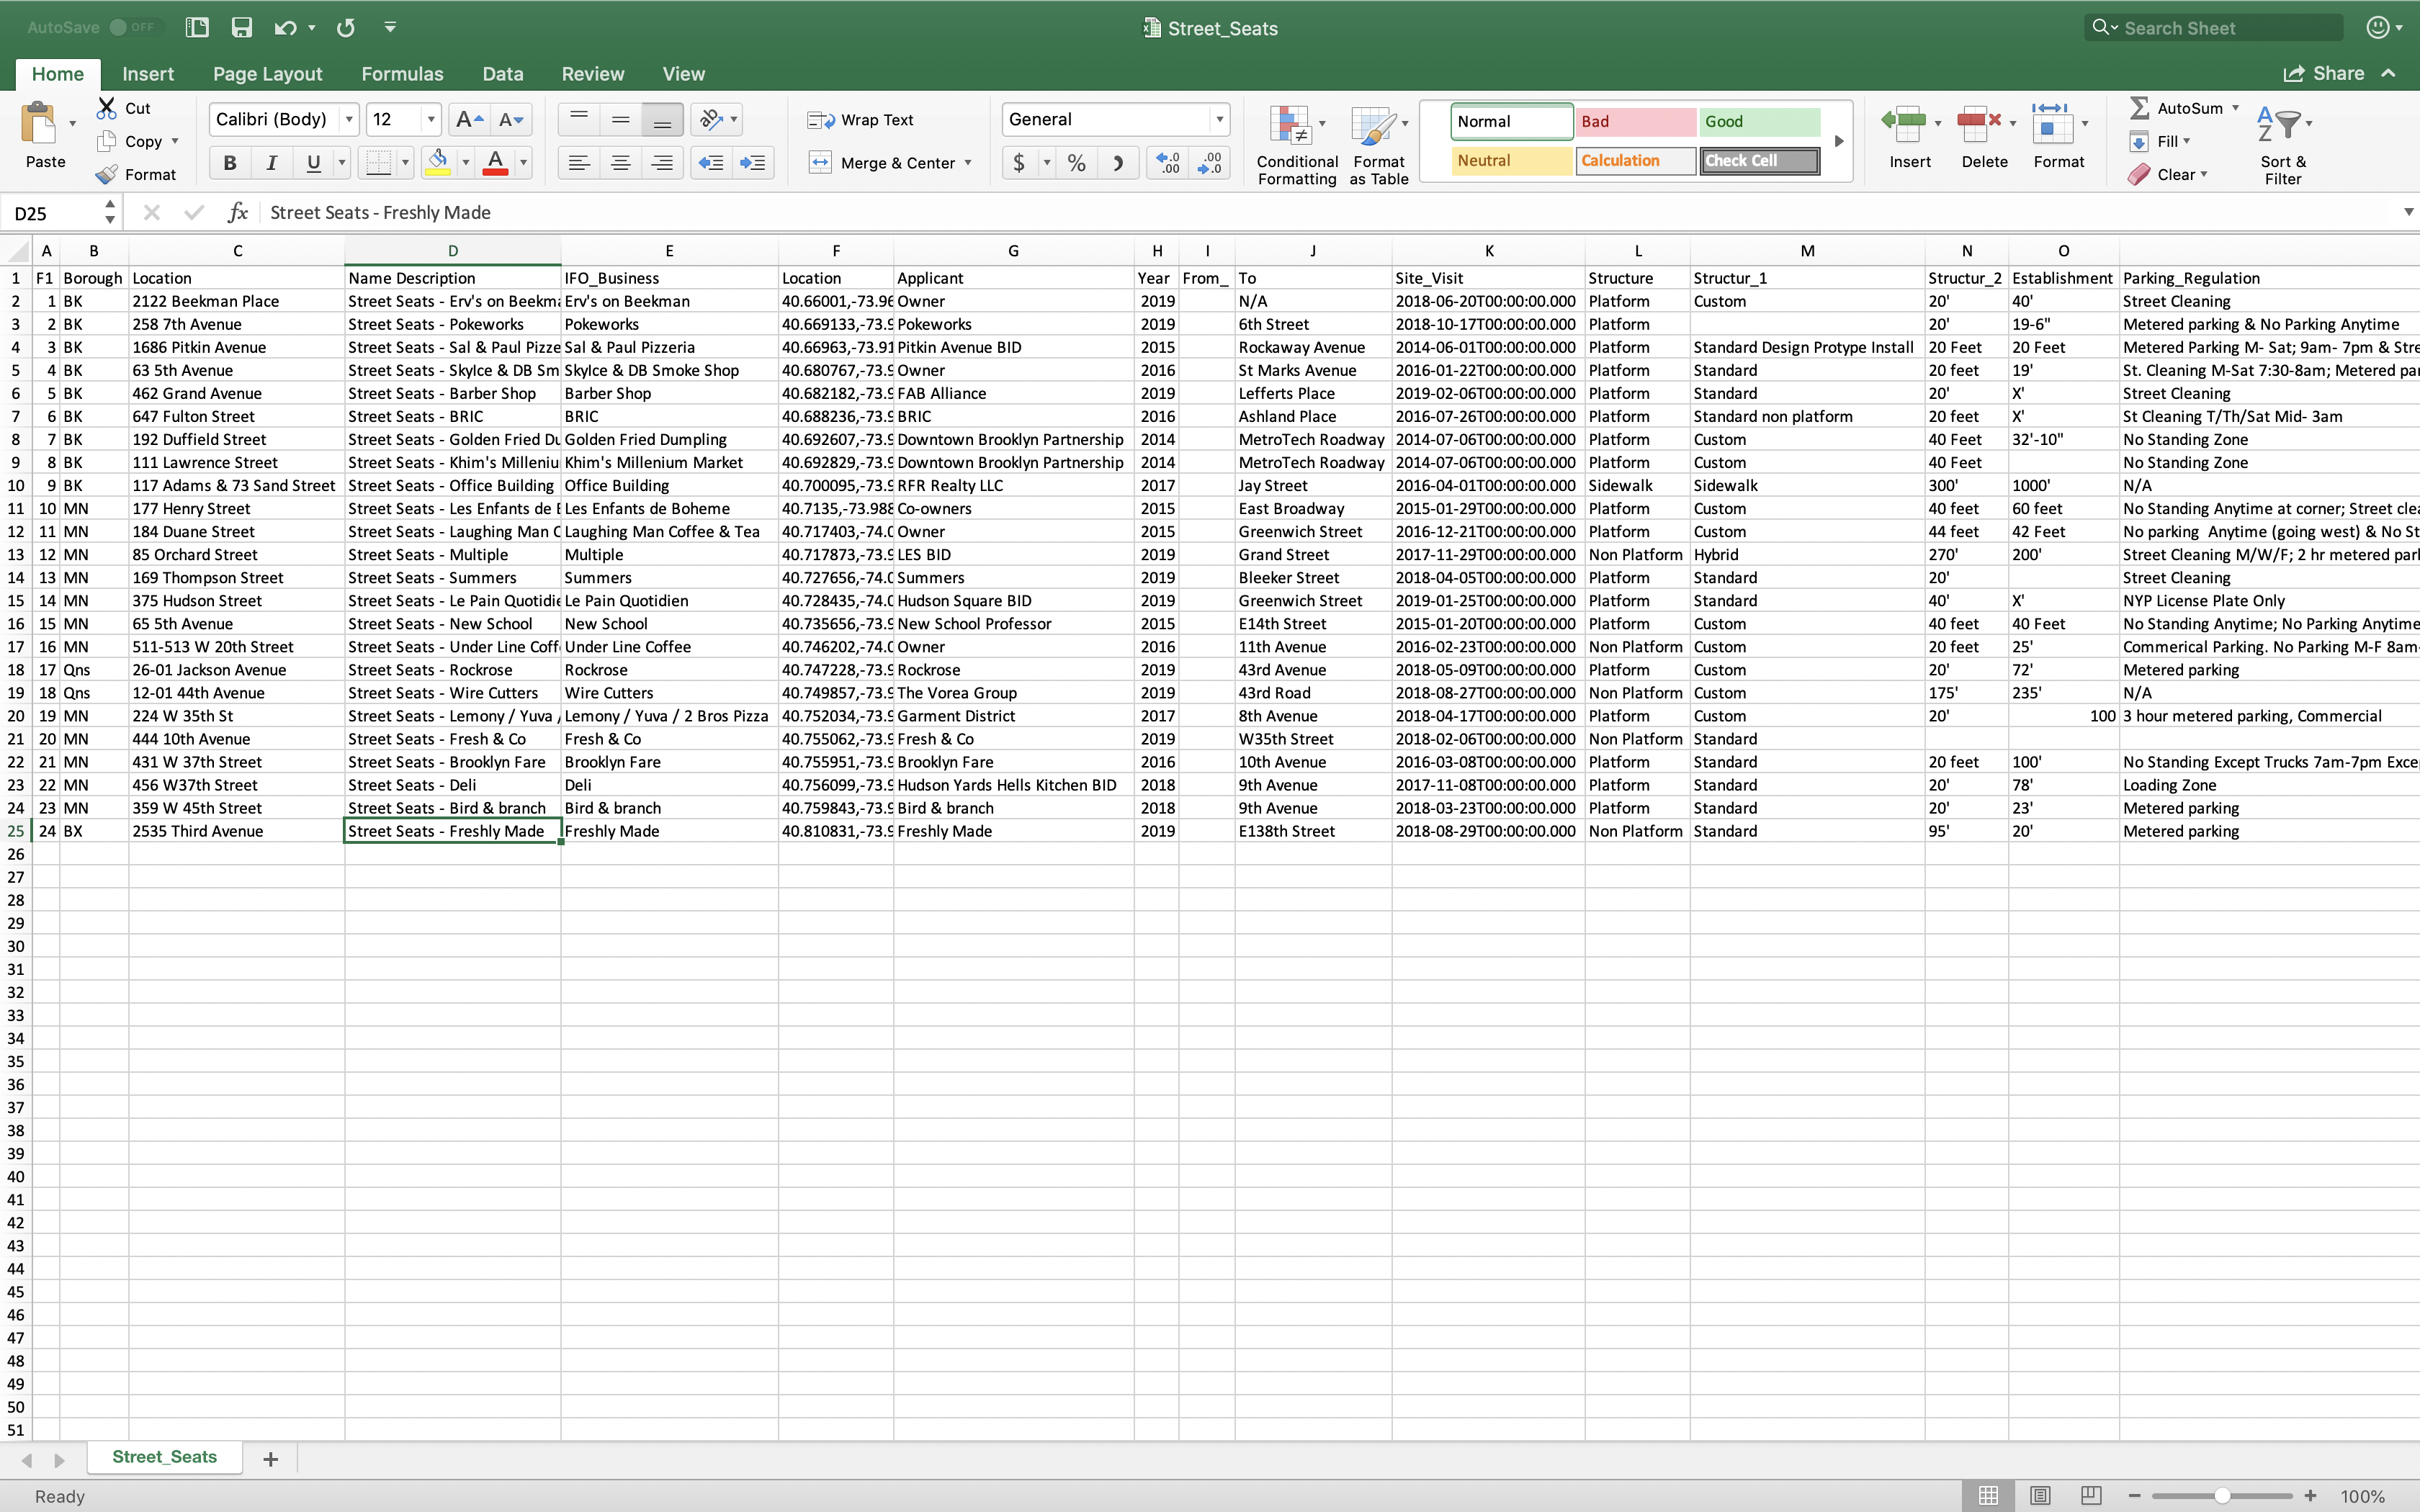
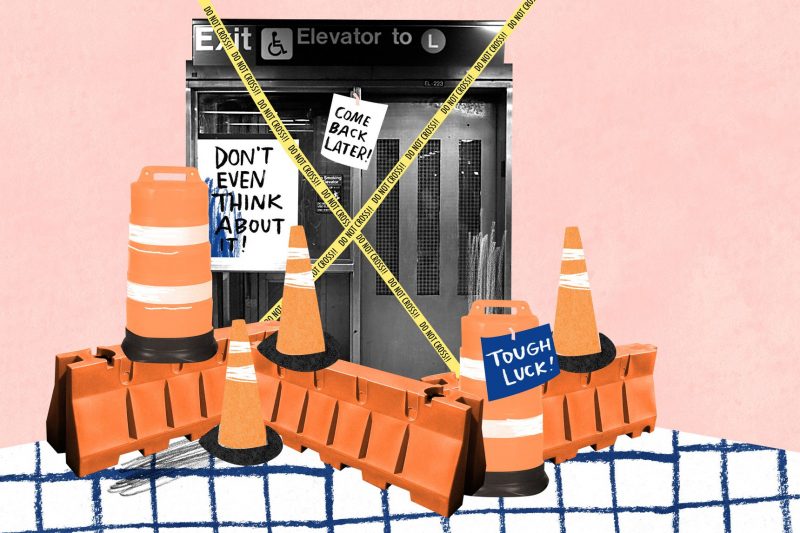
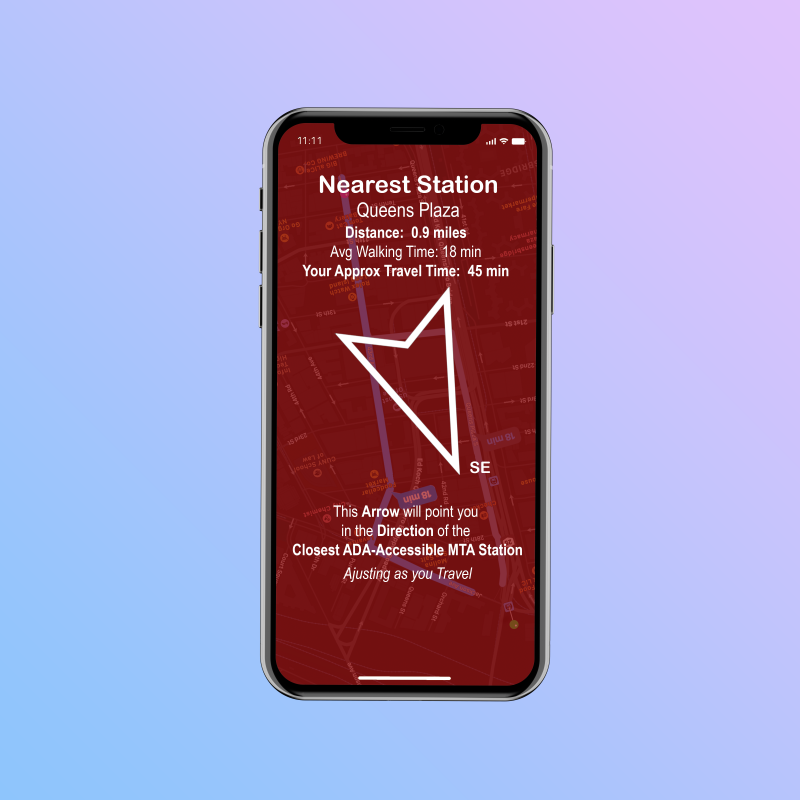
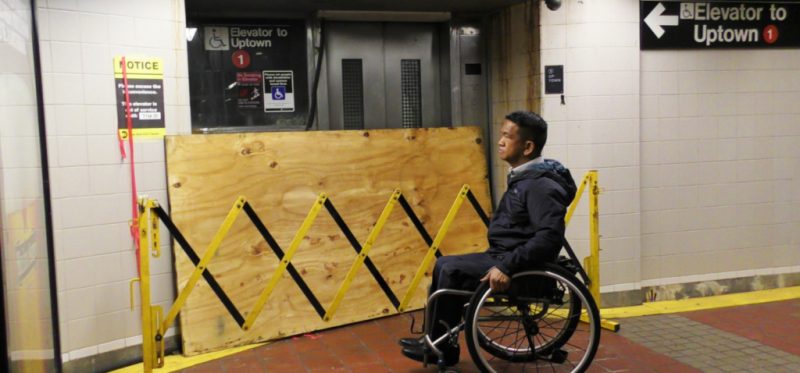
For next week, I’ll keep looking into opportunities in the NYC OpenData site. While I haven’t completely decided, I think I’d like to look into ADA (American Disability Act) compliance complaints, as I use a cane. For this week, I used Streetview Mapper to find all of the places listed in the Street Seats Database and snapped a picture of the Google Maps Streetview image of the street seating areas.
Data Scavenger Hunt
I must have looked through at least 20 databases when I decided I should pick the one that a) made the most sense to use as a data source and b) I found the most interesting. As someone who uses a cane in navigating my way around NYC, I appreciate having a nice place to stop and take a rest. So, I figured, while not exactly a revolutionary association, getting to know what these different street seating areas might look like and in what kinds of areas they may be found might not be the worst thing for me to know more about.
As part of this exercise, I really enjoyed guessing what the area around an address might look like. Having navigated major cities’ metro systems before the advent of the iPhone/smartphone-as-we-know it, I feel like I’m much less in-tune with where places are with respect to one another, including which neighborhood they’re in. Since the fastest way to get somewhere is to ask your phone’s Maps app, I feel it’s been really easy to decontextualize where I’m going since my travels generally start at the same MTA station.
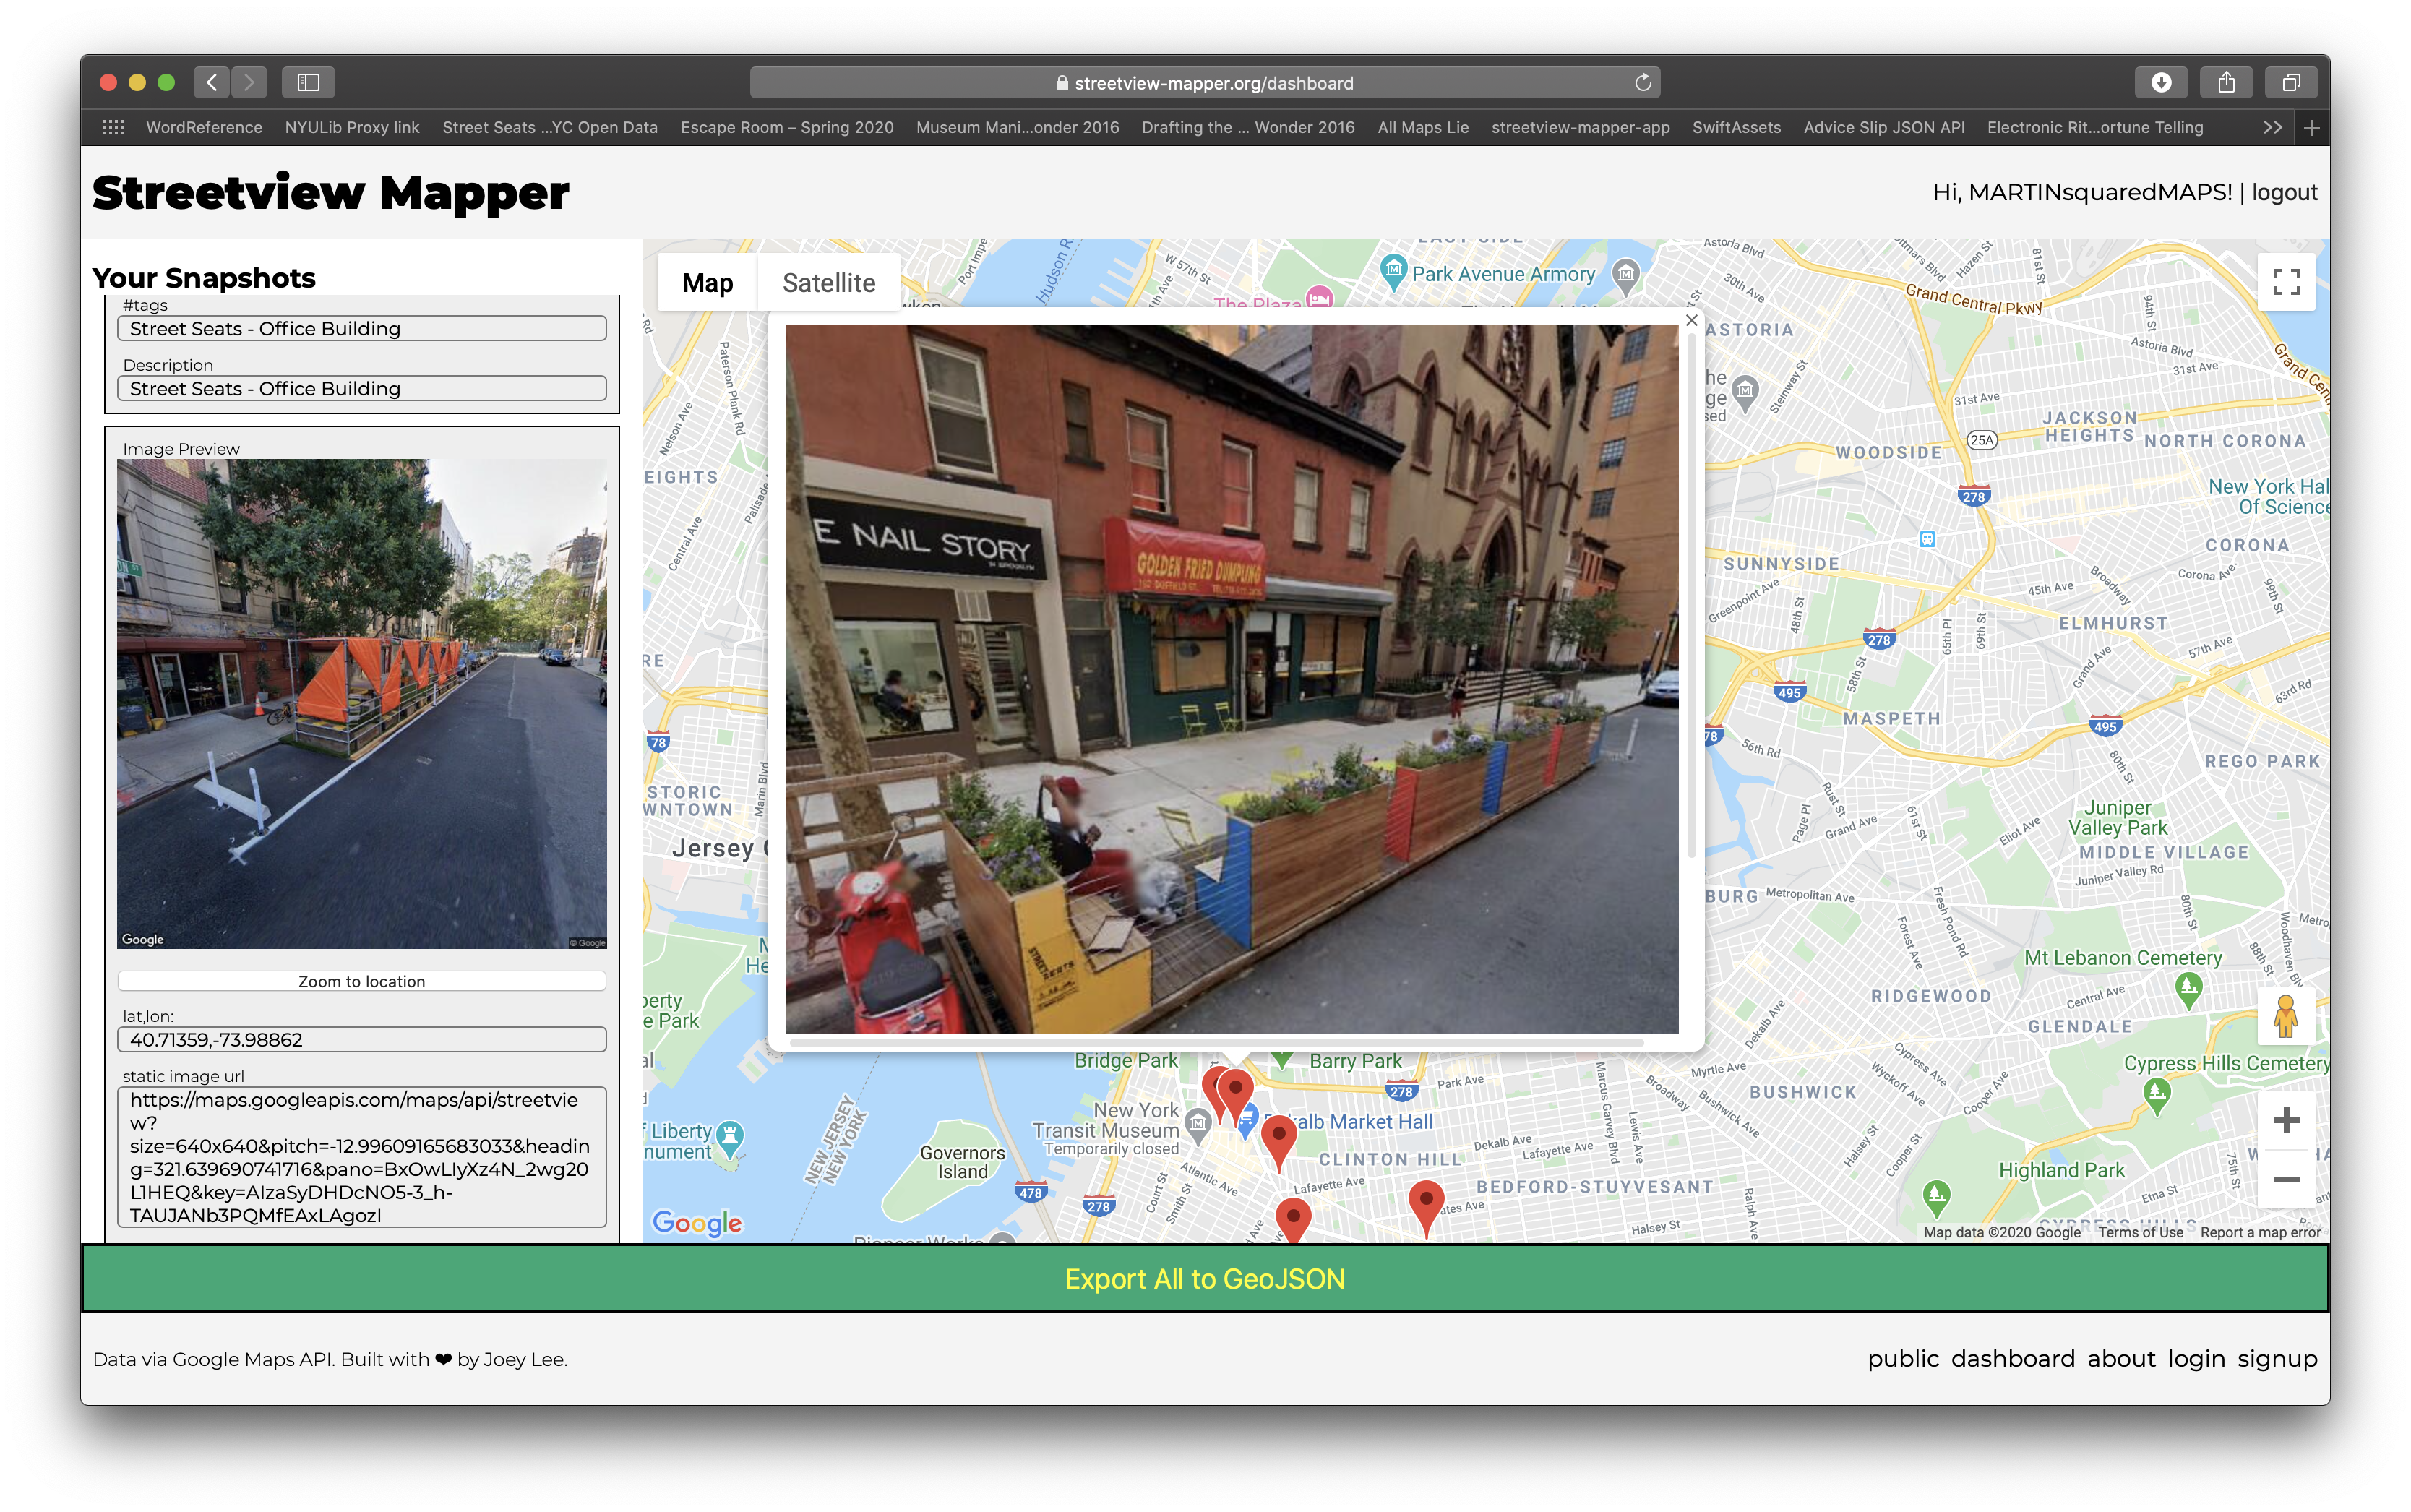
A few observations… For the most part, the types of places these seating areas were found tended to be either on narrow side streets or near/around an office park. They tended to be closer to or on the corner (as opposed to being in the middle of the street.) In almost all cases, they appeared to be associated with a restaurant or cafe; however, interestingly, the street seating areas weren’t always in front of the address given or business named in the Street Seats Database from NYC OpenData.
From this Data Scavenger Hunt, I discovered that Google Maps still has a way to go when it comes to reading my mind. Specifically, when I entered an address, I was hoping to find something the object of my search at or near the address, but I generally needed to do a bit of looking around to find it. There were a couple of places where the address on Google Maps didn’t show the street seating area in the vicinity at all. In those cases, I tended to round the block and look in the area.
So, what have I learned? What can I take away? Well, in the previous example (about not finding the street seating at all), I got a negative space reminder that it’s possible I may not be considering everything. For example, from this exercise, I can’t conclude whether the aforementioned missing seating area was never installed or the Google Streetview image was just taken at a time of the year the seating is removed–because I don’t know what the City’s policy is on leaving the seating out year round. This is an area that, were I furthering my investigation for my final project, I would look into.
From looking at the pictures/dataset from Streetview Mapper as a whole, I noticed I could make the generalizations above about the types of areas the street seating is found in, as well as the types of businesses they are found around. It’s a reminder that visual data is something that can be qualified and categorized with some analysis and classification work. Honestly, I kind of see this type of thing as grunt work; though, I realize it’s an essential part of the process (which must be done meticulously, if you want to come to depend on it.)
As someone who has a tough time reading, I’ve always tended to gravitate toward maps, infographics, and other visual representations of information. After doing this exercise, I’m excited about the potential opportunities to incorporate visual data/imagery and location information into a project, and using it to support a larger argument/theme.


